
Gold Price Forecast
Gold prices crashed from nearly 5600$ to 4300 in less than 2 months. A stark reminder how fast things changes in financial markets , especially in commodities. US Iran war have a major impact on gold prices. Middle east war or any kind of war is a catalyst of gold prices. But gold prices faced a hindrance when US strike Iran on 28th February 2026. Main opposition of gold prices are current interest rate scenario. Crude oil prices are up more than 40% in less than a month which would pave way for higher inflation. Higher inflation won’t be go unnoticed by FED and they would force to hold back further interest rate cuts. In fact I won’t be surprise if Fed starts hiking the rate to control the inflation caused by havoc since 28th February. Dollar Index breached 100 and sustained well after war which put additional pressure in yellow metal.
Gold prices are in tremendous pressure due to fed ‘s hawkish stance on inflation. Despite war gold prices didn’t move due to rising inflation concern. If war prolongs and crude oil prices remain elevated then expect more pressure in yellow metal.
Recent statement from Trump pushed gold prices from 4100$ to 4500$ regarding peace talks with Iran. But we are yet to see any concrete efforts or plan regarding this.
Technical Take on Gold Prices

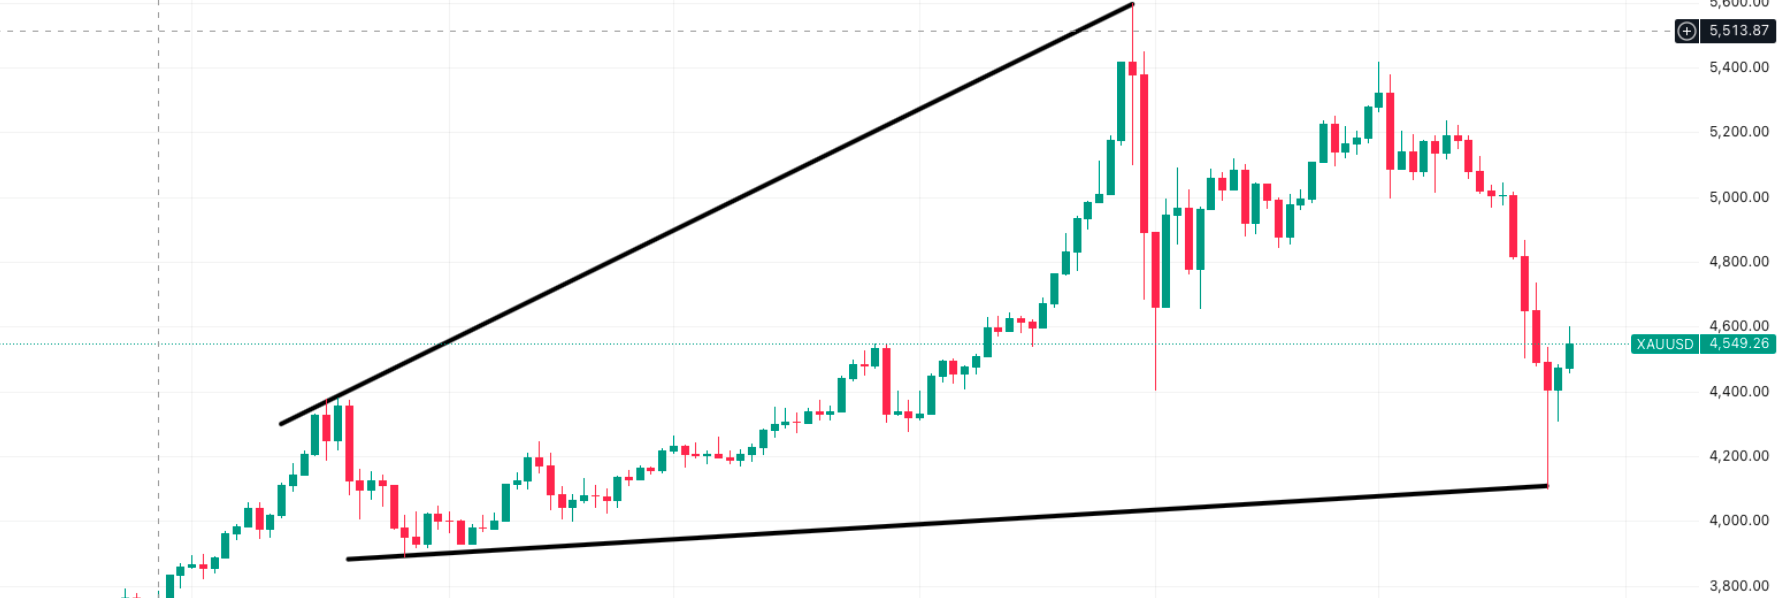
Gold prices peaked in January as it tested near 5600$/oz price. But March Iran US war gave an opportunity to gold prices to reclaim the highs. If war was not connected to crude oil prices we would have surely seen 6000$. But now gold price have damaged the long term chart as it blinked near 4100$ on 23rd March. Trump threaten attack on Iran’s power plants on weekends and comex gold tumbled as soon as it opened. It recovered lately but the main support of 4400$ was taken out before buyers could come to rescue.
Good thing is it didn’t close below 4400$ yet and that is one main thing which just might save this precious metal from sellers. A strong support now stands at 4090$ , this is the level which we need to watch on closing basis. Once gold close below this support then buyers may feel trap just like sellers did in 2025. Below 4090 closing may open gate for 4000$ and 3500$.
Resistance now stands at 5020$. This is the hurdle gold need to break in order to reclaim buyers trust. Once gold close above 5020 then we may see 5200 and even 5500$ very soon.
Conclusion
Gold prices are driven by fundamental factors since 2 years. 1st it was rate cut which resulted in rally from 4000$ to 5600$. Currently its facing another fundamental issue of inflation. If inflation rises then Fed will have no way to cut but raise interest rate to tame inflation. This might result in further collapse of gold prices.
I would keep updating on my Youtube channel regularly. So make sure you subscribe channel for daily updates. Also follow me on X for Data and News related. You may also get Updates on my Whatsapp Channel and Telegram Channel.